“So, How Is The Real Estate Market?”
 “So how is the Real Estate market?”
Whenever I meet up with someone that I haven’t seen in a while, invariably at some point in the conversation, the question will get asked. Besides showing interest in what I do as a profession, people genuinely want to know how the market is doing. For all kinds of reasons, we want to know if it’s going up, down, or just remaining flat.
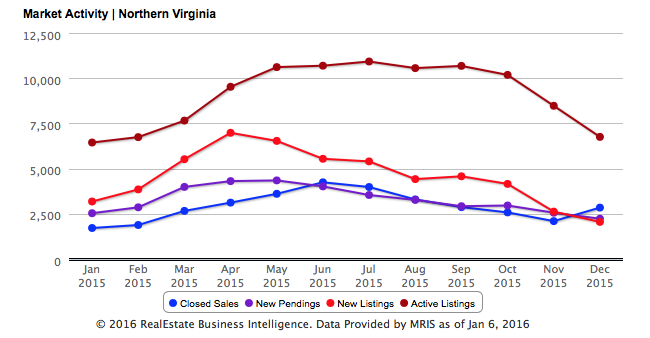
If you want to know how things are going, you don’t have to wait until we meet up. I keep up-to-date, interactive graphs for all the ten cities and counties of Northern Virginia. Most importantly – I have data for the zip code you live in. All graphs have a year of data points for activity, closed sales, new pending sales, and active sales. There is even median sales price, average days on the market, and average sales price to list price ratio. All of this is broken out by single-family detached, townhouses and condos.
Okay, getting back to your question. For all of Northern Virginia, the average “sold price” was $493,667 for 2015 vs. $489,882 for 2014 – a 0.77% increase. The number of properties saw a 9.3% increase, going from 32,932 in 2014 to 35,971 in 2015. Days on the market increased significantly in 2015, going from 46 days in 2014 to 54 days in 2015 – a 17.39% jump.
If you like this type of information, bookmark my statistics page as the information is updated on the 10th of every month.
Of course, you can always call me and ask, “so how is the Real Estate Market?”